Often in the exam, you will be given graphs following some variable over the course of a reaction and will be asked to comment on the change in rate, or to identify where the start or endpoint of the reaction occurs. You may also be asked what effects changing some of the variables considered in the previous article might have on the appearance of the graph – or the opposite – for example, you might be asked to explain the difference between two lines on the graph.
To compare different variables on the rate of reaction, one must make sure that only the variable to be investigated is changed. For example, if you want to compare the effect of concentration on the rate of reaction, two experiments with different concentrations must be set up. However, the temperature of both and the particles size of the reactants and the chemicals used must remain the same in both cases, with only the concentration differing.
Graphs
When monitoring the rate of a reaction, it is common practice to produce a graph illustrating the change in one particular quantity over time. This quantity will result in different looking graphs.
Volume
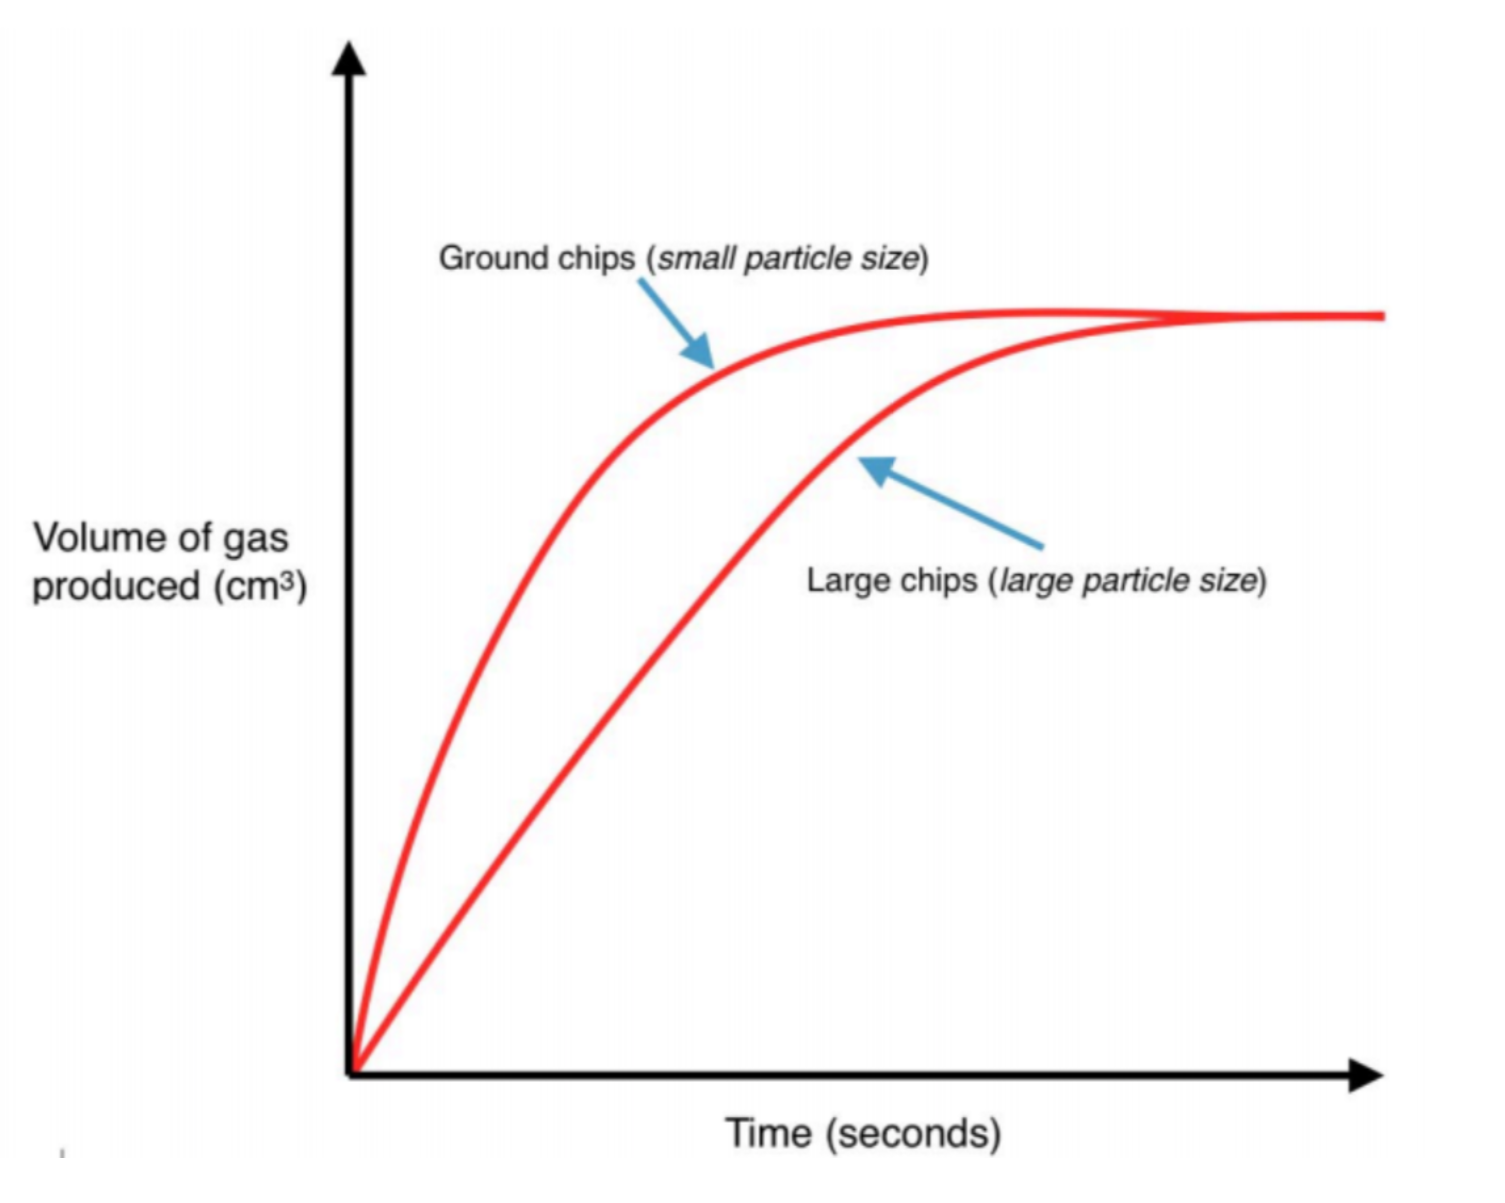
If a gas is given off during a reaction, the volume of the gas can be measured. Recording it on a graph will result in a curve which increases until it reaches a maximum when there is no more gas being given off. This is when the reaction has finished – no more gas is produced and the graph levels out.
A typical graph monitoring the change in volume of gas produced over the course of a reaction
If the rate is sped up by altering the particle size, concentration, temperature or using a catalyst, the graph will be steeper, resulting in the maximum volume reached more quickly.
A change in rate has no effect on the starting volume or end volume mass – only how quickly it takes to get there!
Mass
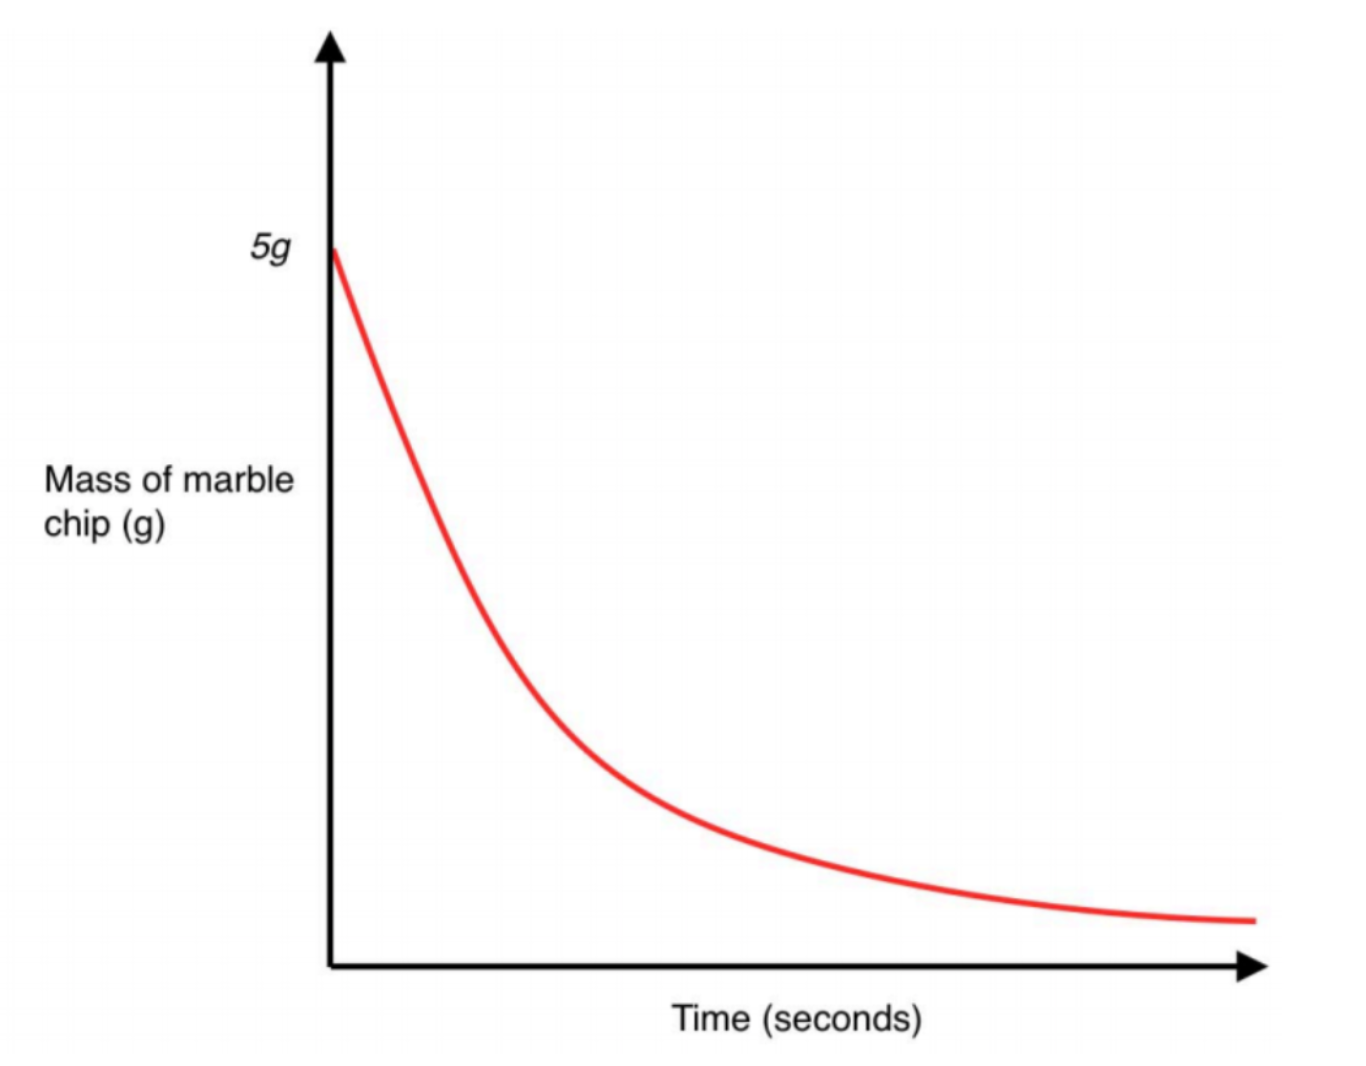
If a gas is given off during a reaction, then it will escape into the air. This means that we have some chemicals disappearing from the system. This will result in the overall mass on a balance decreasing. The endpoint is where the graph levels out. An increase in the rate will result in a steeper graph, a decrease in rate will result in a graph with a more shallow gradient.
A typical graph showing the change in mass of a reaction where marble chips are dissolved in an acid, releasing carbon dioxide. A similar graph would be produced if the marble chips were replaced with magnesium ribbon – hydrogen gas would be released instead of carbon dioxide
A change in rate has no effect on the starting mass or finishing mass – only how quickly it takes to get there!
A first in this series of blogs I hope to write in the coming weeks, focusses on the types of questions concerned with the reactions rates topic. Now, despite being a PhD student, I come from teaching the National 5 and Higher and Advanced Higher curriculum, so I shall base these articles on the structure of that course, however I intend to be writing this in my words, not confined as I am to a specific curriculum.
The National 5, and indeed GCSE curriculums are designed as a formal introduction to Chemistry. You may well have encountered aspects of the courses before, however now you are expected not only to remember key facts, but to put into practice your learning and prove your worth in the exam.
Reaction Rates
One can categorise most questions in an introductory rates topic into three types : first, explaining the influence of various factors on the overall rate, or indeed suggest how to increase or decrease it, or what effect some suggestion would have on the rate; second, you may observe and interpret a reaction graph and either deduce the overall rate, or explain what is happening after a specific time, or even predict what may happen to the graph should some method be used in an attempt to alter the rate; or third perform a calculation. Of course, this is a vain attempt to simplify the workings of the examiner’s mind, something not to be attempted lightly!
So lets elaborate on these three areas. This post shall concern itself with the chemistry of influence type questions.
Influence
In an introductory course, we consider there to be four ways of influencing the rate of a reaction. We shall explore these here and investigate the why (why they do what they do to the rate), and the how (how you can use them to control the rate of a reaction).
Temperature
Perhaps the first variable a school pupil encounters when speeding up a reaction. Warming up a reaction mixture often speeds things up. A classic is the sodium thiosulphate and hydrochloric acid reaction – done at room temperature, the colour change from clear to milky white can take over a minute (and accompanied by the unmistakable pungent rotten egg’s smell all too common where sulphur is concerned!). Warming up the reactants on a Bunsen flame before hand results in a reaction that takes only seconds!
Why? Think back to the most basic science lessons – solids, liquids and gases. Everything is made of tiny particles (we know them to be atoms and molecules by this point!). In a solid, they are held together by forces or bonds most rigidly; in a liquid, very loosely, allowing them for flow around; and in a gas, not at all – they can float about to their hearts content. As we go from solid to gas, the particles (molecules) gain thermal energy, which is converted into kinetic energy – motion. Very little motion in a solid, but lots of it in a gas. This gradient of motion is very pronounced in a liquid. A cold liquid (ahh this is very relative of course, for liquid helium is mega cold; liquid water – even at 5°C is warm by comparison! Let us define this by saying that a cold liquid is one near its freezing point, and a warm liquid is one nearer its boiling point) has little thermal energy. Its particles can move only slowly, so they trudge around at a snail’s pace (like old age pensioners walking five abreast down the high street with not a care for other pedestrians trying to get to the train station on time…). Warm it up a bit and you give the particles more energy, permitting them to whizz around like manic first years eager to get to the canteen at lunch time. Not only do the particles now have more speed (kinetic energy), but when they inevitably collied with one another, they will do so with greater force. Think of the old age pensioners – if they wonder around slowly and bump into one another, the bump will only be gentle. However if a first year is careering down the corridor, and another one is running towards them, should they crash into one another, there very well could be some physical damage to someone! Hot particles wallop one another with greater force and more often. This high frequency of wallops means that successful reactions are more likely at higher temperatures than at colder temperatures, and therefore the reaction takes place more quickly.
Effect of temperature on particle motion
How can we use this? Well simply put, if you want to slow down a reaction, cool it (in my current work I perform Grignard reagent synthesis which needs buckets of ice to slow down, otherwise it gets so exothermic that explosion is a real risk. Other reactions involving hazardous substances such as n-butyl lithium requires one to use a mixture of petroleum ether and liquid nitrogen to bring the system down to -78°C to make things safe! On the other hand, if you need to speed up the reaction (some can take days or even months otherwise), then increasing the temperature will significantly speed things along.
In your exam, you may be shown an example of two or more reactions and asked to determine which has the fastest rate. If all other variables are the same (concentration, particle size), then whichever has the highest temperature will react the fastest. In other cases, you may be presented with a graph of a reaction. Temperature will not affect the quantity of product, so the final hight of the graph will not change if temperature is altered – what will change is the steepness of it – its gradient – better described in this instance as the time taken for the graph to flatten out and stop changing. The line from the reaction with the highest temperature will be the steepest – reaching its end point quickest – the reaction performed at a lower temperature will be the one which takes the longest to reach the end point.
Particle Size
Ah-ha – time for some maths! I find the best way to explain particle size to my pupils is to run them through a bit of geometry. Nothing too fancy, but a revelation when you get it, and a nice way of bringing in a bit of cross-over between the STEM subjects!
First off, lets summarise it – larger particle sizes, slower reaction – smaller particle sizes, faster reaction.
Why? Well the wording of the explanation, looks a bit counter intuitive since the real reason is not the particle size per say, rather the surface area. Smaller particles have a much larger surface area than larger particles. So a fast reaction – small particles – large surface area. A slow reaction – large particles – small surface area.
The maths and a bit of technical drawing (great for the Graphic Communications pupils!) helps get your head around this.
Imagine a cube of calcium carbonate (marble chip) 10mm wide, 10mm high and 10mm deep
Effect of particle size on surface area
What is its surface area?
Quite simply, the surface area of a cube is the area of each face added together. The area of a face is its length times its height – so here it is 10 mm x 10 mm = 100 mm
A cube has 6 faces so, 100mm x 6 = 600 mm2
So our cube of calcium carbonate has a total surface area of 600 mm2
Now lets take a chemical knife and slash the cube in half, straight down the middle, then slash it again across its waist, right in the middle, and finally through the horizontal plane. We now have 8 mini cubes, each with dimensions half of that of the original cube – 5 mm by 5 mm by 5 mm
Now lets work out the surface area of our smaller particle sizes.
The area of one face is 5 mm x 5 mm = 25 mm,
So far, so smaller than before.
As before, we have 6 faces on a cube, so 25 mm x 6 = 150 mm2
But this is less than before!? But wait! We have 8 cubes this time.
So our total surface area must be 150 mm2 x 8 = 1200mm2
So by reducing our surface area by a half, we double our surface area!
This means that with smaller particles, we expose more surfaces from the inside. If we were reacting the calcium carbonate with hydrochloric acid say, this means that we now have more faces exposed on which the acid can attack. Faces that would otherwise have been protected when the particle was larger.
It is unlikely that you will ever be asked to perform this calculation in an exam, by I urge you to try it for yourself with a particle with sizes of your choosing (maybe 20 mm, 25 mm or 5 meters). Better still, get some plasticene, blu-tac or better still, cut up some wood, and measure the dimensions yourself to prove it to you!
How can you use this? If you are given a reaction with magnesium ribbon, you could speed it up by cutting the magnesium into smaller pieces, or better still, grinding it into a powder. Slowing a reaction down can be achieved by the opposite – compacting the substance into a larger particle. Think about sugar cubes – they take longer to dissolve in tea than granulated sugar.
A graph will be altered by particle size thus : if you have smaller particles (larger surface area) the reaction rate will increase, so the time taken to reach the end of the reaction will reduce – i.e. a steeper gradient. Larger particles (smaller surface area) will mean that the reaction rate will decrease – taking longer to reach completion – i.e. a shallower gradient.
Concentration
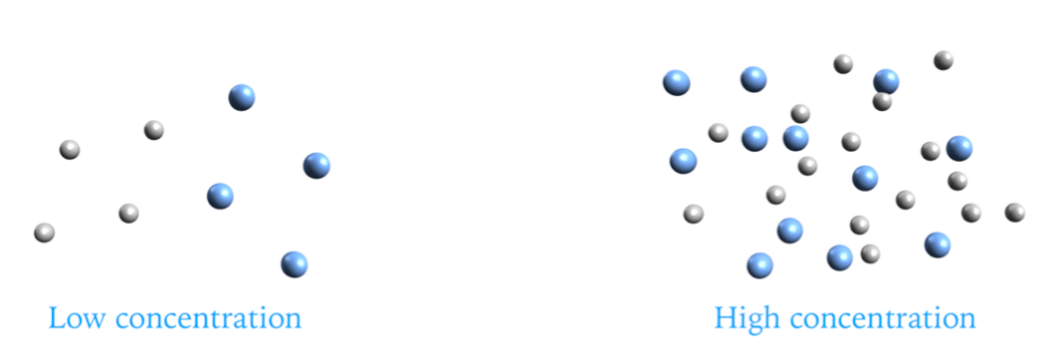
Perhaps the most obvious and easy to explain effects. A high concentration means that there are more reactant particles present in a set volume of the solvent. A low concentration means that there are fewer reactant particles present in the same volume of solvent.
The more concentrated a solution, the more reactant particles there are, so the chances of collisions is greater, so they take place more frequently, and the reaction rate is faster.
Why? Well imagine if you will a crowded sports hall, so full of people that there is no more than 1 meter between each of them. They are all milling around randomly. Take yet another group of first year pupils and set them running into the hall with the task of reaching the other side of the room in as little time as possible. What happens? Carnage. It is inevitable that most, if not all of the pupils will collide with the people wandering around very quickly (fast rate) as their concentration is so high.
Effect of concentration
Lets say we repeat this experiment with the same room, the same number of first years, but the number of people wandering aimlessly around the hall is reduced to just 1 person. What happens? Depending upon that sole person’s location in the room, either all the first years make it across the room without incident, or (in the least likely scenario) one pupil collides with them. At the end of the day, minimal carnage (a slow rate). This is because the concentration of people in the room is so low that the chances of a successful collision is minimal.
This analogy is directly transferable to that of chemicals in a reaction – the more you have present, the more likely successful collisions are to occur and the rate is increased. Fewer reactants in the same volume, and the rate of the reaction is reduced.
How does this help me? If you encounter a question asking you how to speed up a reaction, using more concentrated solutions will help. To slow the reaction down, dilute the reactants – make them less concentrated. One such example could be yet again the reaction of hydrochloric acid with marble chips. To slow this reaction down, one could dilute the acid with more water. If you have the choice of HCl with a concentration of 0.1 mol/L, 1 mol/L and 2 mol/L, then the most dilute (0.1 mol/L) will take the longest to react, being the most dilute (least concentrated), whereas the highest concentration, 2 mol/L, will react the quickest.
A nice demonstration of this is to take dilute HCl (0.1 or 0.01 mol/L) and much more concentrated HCl (4 mol/L or stronger) and add a piece of magnesium ribbon to each at the same time. Many mobile phones are made from a magnesium alloy these days, so the reaction which the pupils will see will be quite similar to that they might encounter should the teacher drop a pupil’s phone in a beaker of the stuff (but without the resulting paperwork and fire hazard, and awkward conversation with the head teacher…). The weaker acid might result in a few, tiny bubbles, but the more concentrated acid will dissolve the metal completely in a matter of seconds. I would also suggest repeating this with an item of food – gives a good idea as to how the acid in your stomach works (which incidentally is also HCl).
Catalysts
The final method of influencing the rate of a reaction is to use a catalyst. This differs from the previous three since it involves adding an additional chemical, not related to the reactants.
There are two types of catalysts – homogeneous and heterogeneous. A homogeneous catalyst is in the same state as the reactants (a liquid if the reactants are both liquids), whereas a heterogeneous catalysts is in a different state to the reactants (a solid if both reactants are liquids, or gases).
The way a catalyst works is a bit more complicated, and the actual physics and chemistry of it is too advanced for an introductory course, but basically, they work by reducing the activation energy (the energy required to start the reaction) of the reaction and are not used up in the process.
In a homogeneous catalyst, the catalyst compound might form an entirely new compound with the reactants temporarily, but will be reformed at the end of the reaction.
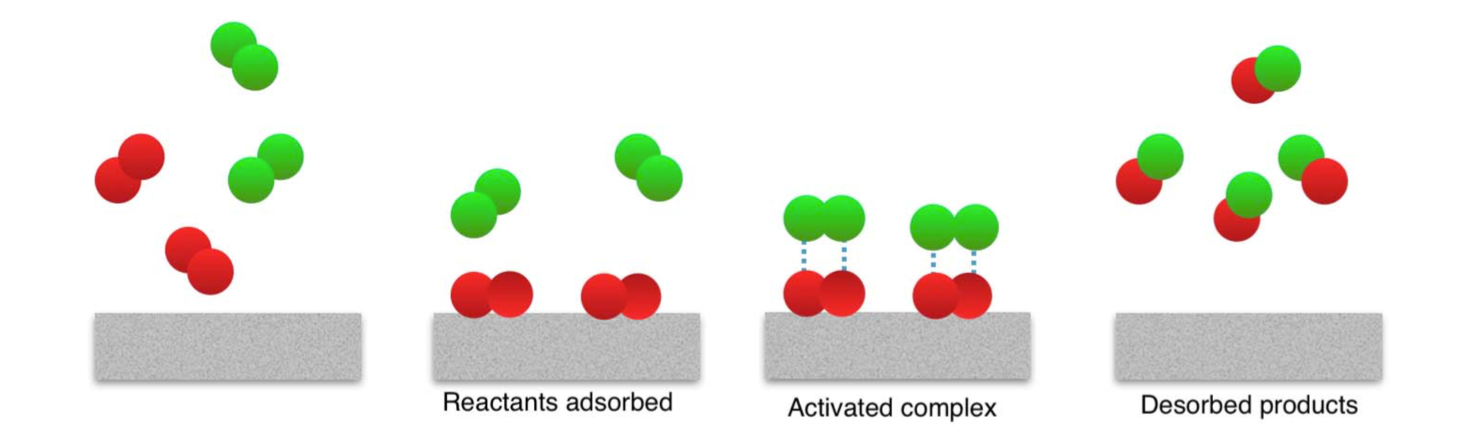
A heterogeneous catalyst works by creating a surface upon which a reaction can take place – holding reactants in place so that collisions with other reactants occur more readily, then releasing the product upon its formation. At the end of the reaction, the catalyst surface is once again clean with no reactants attached to it.
A heterogeneous catalyst
If you were to weight out 10g of a catalyst, perform numerous reactions on it, at the end of the day if you were to reweigh it, you would still have exactly 10g of catalyst, regardless of how much reactant you used. Unfortunately, this would not be the case should you lose any through spillage or poor filtering, or general bad lab technique.
Catalysts can however suffer from poisoning. When a catalyst is poisoned, a chemical sticks to its surface, or reacts with it to bond so strongly, that it is impossible to be removed in the course of general use. This means that the catalyst is less effective at speeding up a reaction. When this happens, the catalyst is removed and has to undergo regeneration (further reactions to remove poisons) before it can be used again.
One example of a catalyst is the platinum / rhodium catalyst used in the catalytic converter in a car’s exhaust. This involves a honeycomb lattice of the metals upon which the products of incomplete combustion – carbon monoxide for example – are oxidised to produce the safer carbon dioxide. Impurities in the fuel can lead to poisoning of the catalyst. Leaded petrol is particularly hazardous to the health of a catalyst, as the lead binds irreversibly to the catalyst, poisoning it and preventing it from working effectively.