
Interpreting
Often in the exam, you will be given graphs following some variable over the course of a reaction and will be asked to comment on the change in rate, or to identify where the start or endpoint of the reaction occurs. You may also be asked what effects changing some of the variables considered in the previous article might have on the appearance of the graph – or the opposite – for example, you might be asked to explain the difference between two lines on the graph.
To compare different variables on the rate of reaction, one must make sure that only the variable to be investigated is changed. For example, if you want to compare the effect of concentration on the rate of reaction, two experiments with different concentrations must be set up. However, the temperature of both and the particles size of the reactants and the chemicals used must remain the same in both cases, with only the concentration differing.
Graphs
When monitoring the rate of a reaction, it is common practice to produce a graph illustrating the change in one particular quantity over time. This quantity will result in different looking graphs.
Volume
If a gas is given off during a reaction, the volume of the gas can be measured. Recording it on a graph will result in a curve which increases until it reaches a maximum when there is no more gas being given off. This is when the reaction has finished – no more gas is produced and the graph levels out.
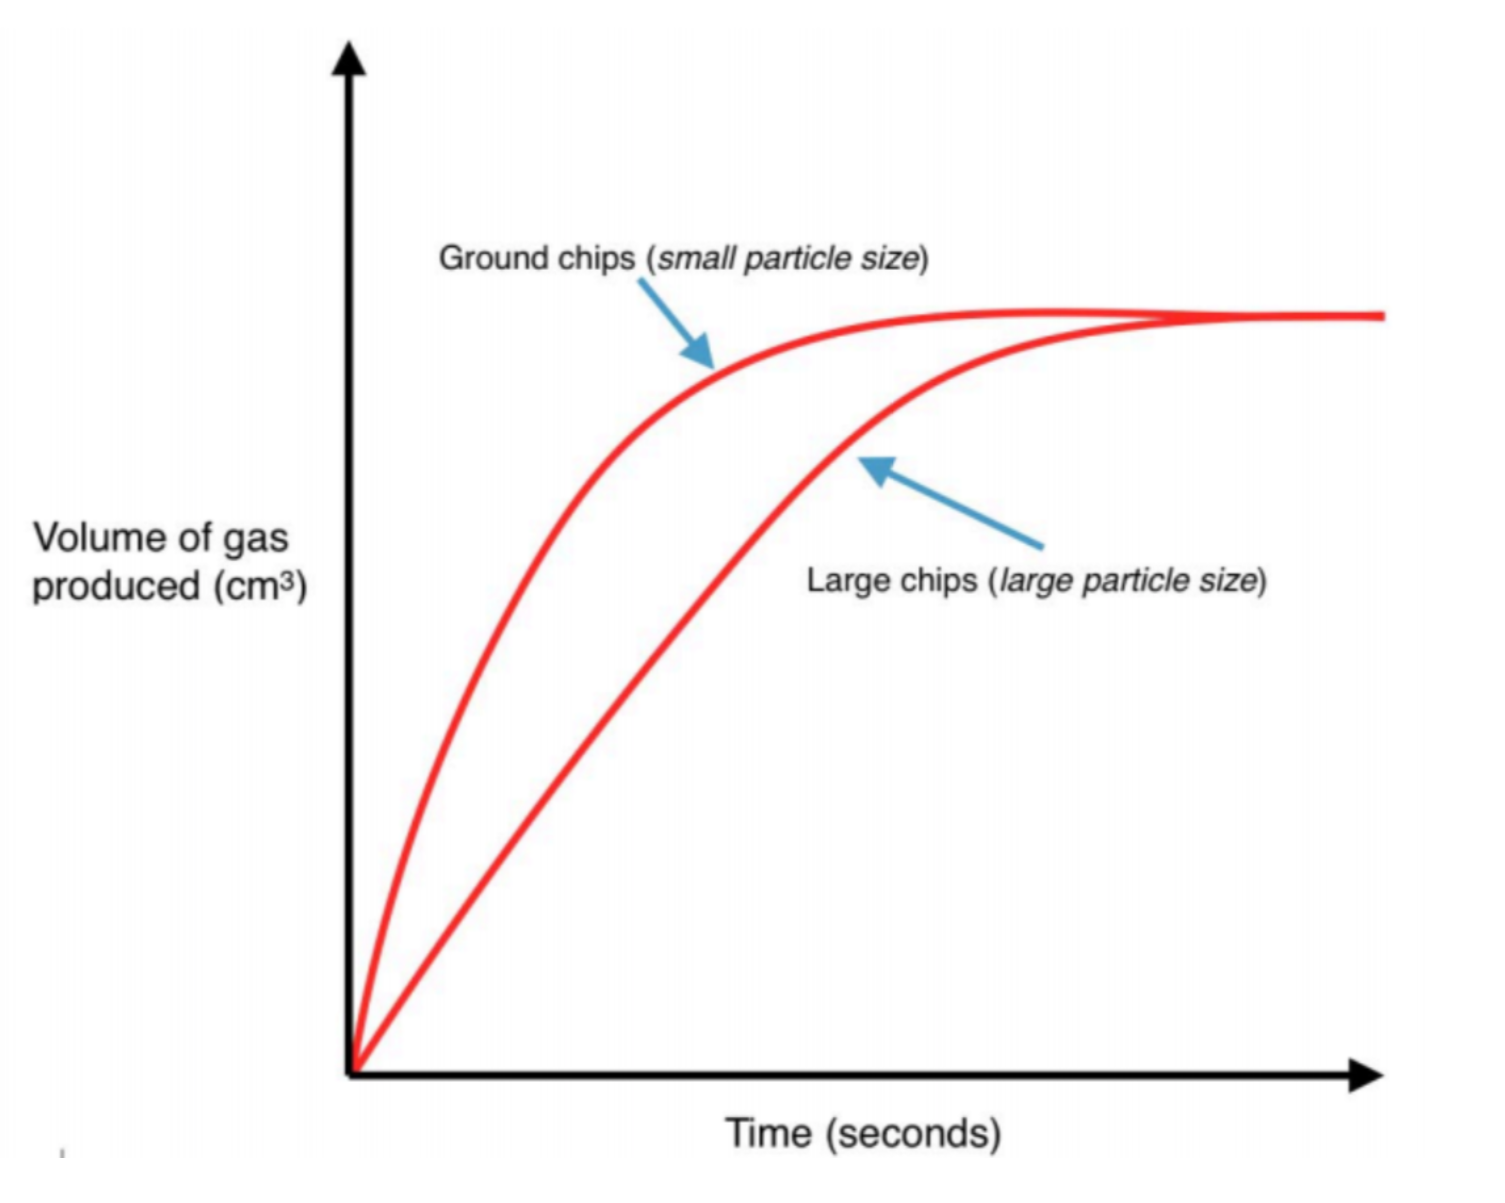
If the rate is sped up by altering the particle size, concentration, temperature or using a catalyst, the graph will be steeper, resulting in the maximum volume reached more quickly.
A change in rate has no effect on the starting volume or end volume mass – only how quickly it takes to get there!
Mass
If a gas is given off during a reaction, then it will escape into the air. This means that we have some chemicals disappearing from the system. This will result in the overall mass on a balance decreasing. The endpoint is where the graph levels out. An increase in the rate will result in a steeper graph, a decrease in rate will result in a graph with a more shallow gradient.
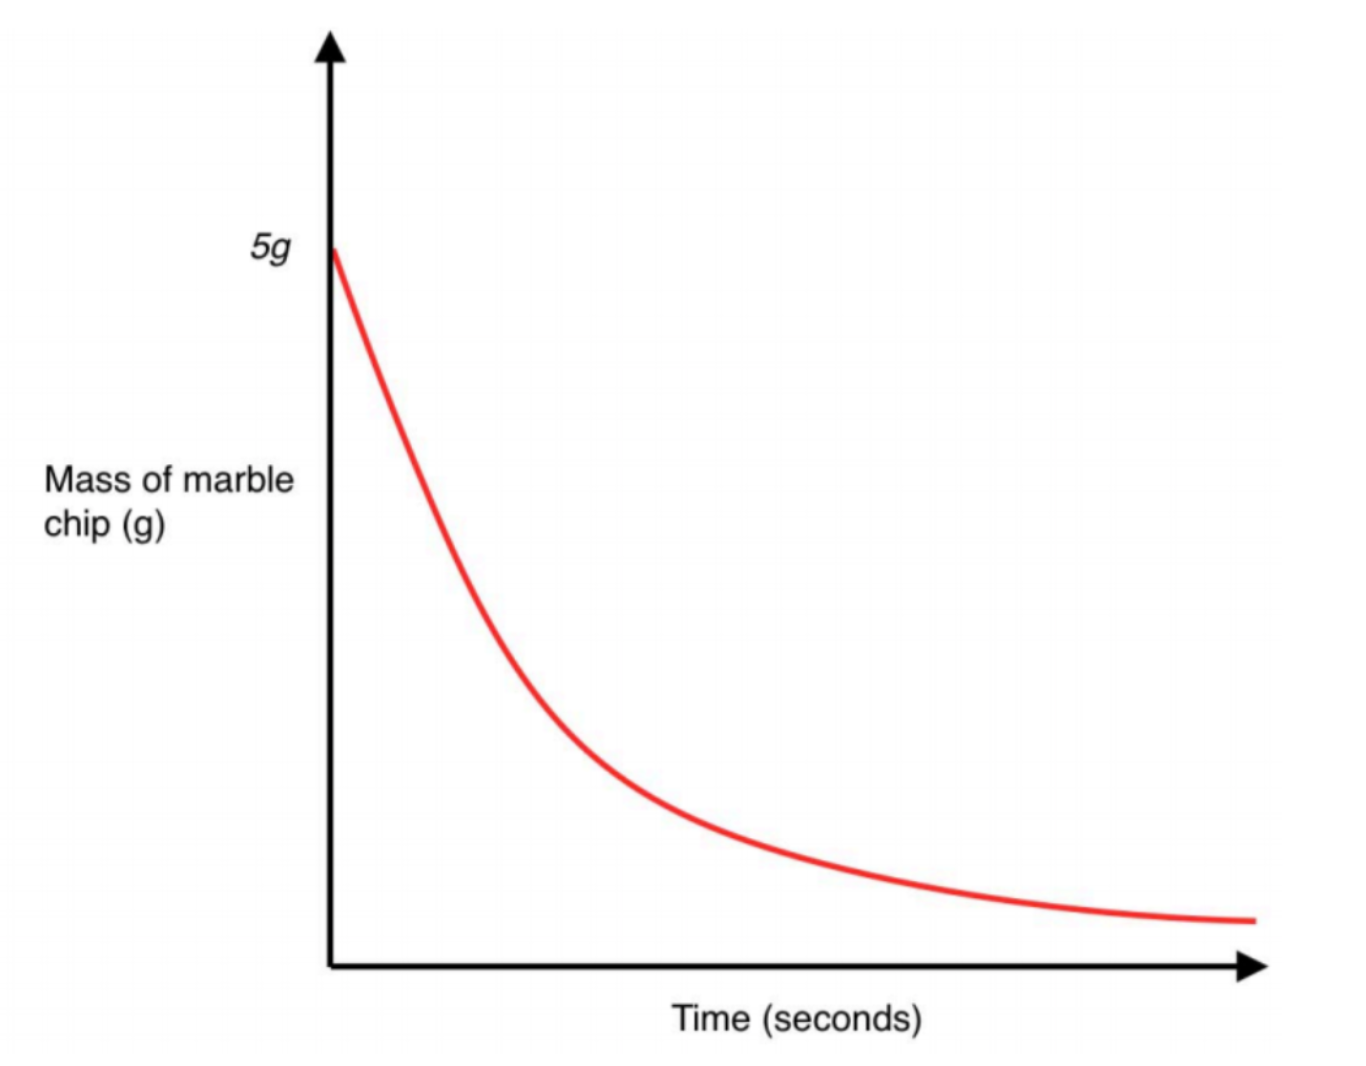
A change in rate has no effect on the starting mass or finishing mass – only how quickly it takes to get there!
